
A Guide to Measuring the ROI of UX

The user experience industry has experienced explosive growth over the past five years. More than ever, teams are turning to user testing to improve the holistic customer experience. To those not familiar with the industry, you may have heard of usability testing. It’s a method of ensuring your website or prototype is intuitive for visitors to accomplish their goal. However, that’s only a tiny part of the user experience ecosystem.
In itself, the term user experience is qualitative. It’s thought of as “making something delightful for customers.” Customer delight isn’t directly measurable and probably won’t make you or stakeholders dive in wallets first.
You may have arrived at this post looking to quantify your current UX investment. Or you may want to justify a future investment to stakeholders. There are many famous quotes such as “each dollar invested in UX returns $10 to $100” and “companies investing in UX have outperformed the S&P by 228%”. But how do you quantify that on a smaller scale? This article will provide guidelines for measuring the impact of your user experience testing investment.
Conversion rate
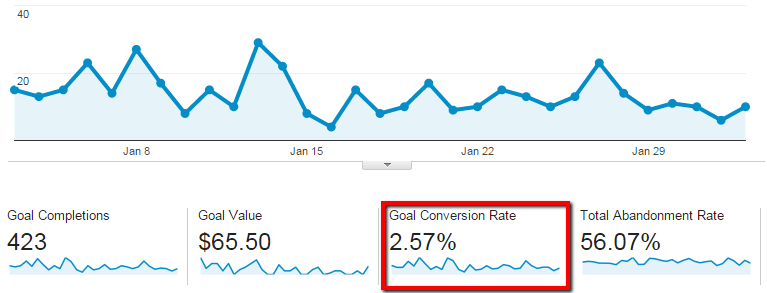
The first way to measure the ROI of UX is with conversation rate. Conversion rate is defined as the percentage of people who take a ‘desired action.’ The ‘desired action’ depends on what you’re driving participants to do. It could mean signing up for a blog or checking out your shopping cart.
![]()
We suggest measuring the conversion rate over a period of time. Typically, that period should cover a full sales cycle, so it’s a representative sample. After you’ve invested in UX, measure it again to see if the conversion rate is improving. To make it an apples-to-apples comparison, perform your analysis at the same time of different years. It wouldn’t be a fair comparison to compare July- August conversions with October-November conversions. We realize that it might not be realistic since it would take a long time to prove the ROI of UX. Therefore, comparing month over month conversion rate improvements will have to do the trick.
A/B testing call-to-action buttons, text, and images will allow you to see what resonates with visitors. However, to understand ‘the why’ conduct qualitative user research such as moderated or unmoderated research.
Bounce rate
Bounce rate is the percentage of people who view one page before leaving. Optimizing a page with user experience research will drive participants to stay on your website and visit other pages.
![]()
Use the bounce rate before UX investment as a benchmark. Compare it to the bounce rate after making research changes to see the ROI of UX.
Although this may not be an exact comparison, you can compare the optimized pages against the ‘untested’ pages. Determining how many people bounce on the UX tested pages vs. ‘untested’ pages will provide a quick comparison of your efforts. Easily pull bounce rates from Google Analytics.
NPS
Net promoter score is used to understand customer’s loyalty to a brand. Research claims that it’s correlated with revenue growth. If you believe that logic, you’ll be able to measure customer satisfaction as well as potential revenue growth with this metric. Measure NPS before investing in user experience as a benchmark. Once you’ve performed user research and implemented it, send an NPS survey to customers. This method may take longer than other methods, since improving customer experience isn’t an overnight exercise. By the time you perform UX research, update designs, implement the code, you’re probably looking at a solid six weeks of work.
Chatbot Support Requests as means of Measuring ROI of UX
Chatbots are heating up the customer experience space. Having a chatbot on your website makes your team accessible to quick questions that customers may have. After all, “64% of internet users say 24-hour service is the best chatbot feature.” The experience of interacting with a chatbot makes websites more enjoyable. People are more likely to ask clarifying questions with chatbots so that bounce rates will be lower.
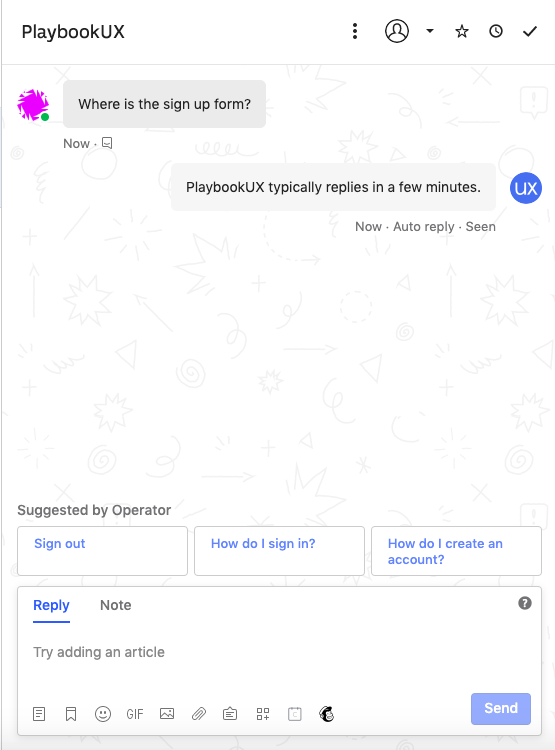
Chatbots offer interesting insight into confusing points of your product or website. Looking at conversation logs to determine common questions will guide design updates. These support requests from customers could take any of the following forms
- “I can’t find XXX”
- “How do I perform XXX action”
- “Is it possible to XXX”
Once you’ve updated designs based on common pain points, test them before development to ensure you’ve hit the points of confusion. Compare the questions asked before UX investment with the questions afterward to see improvement.
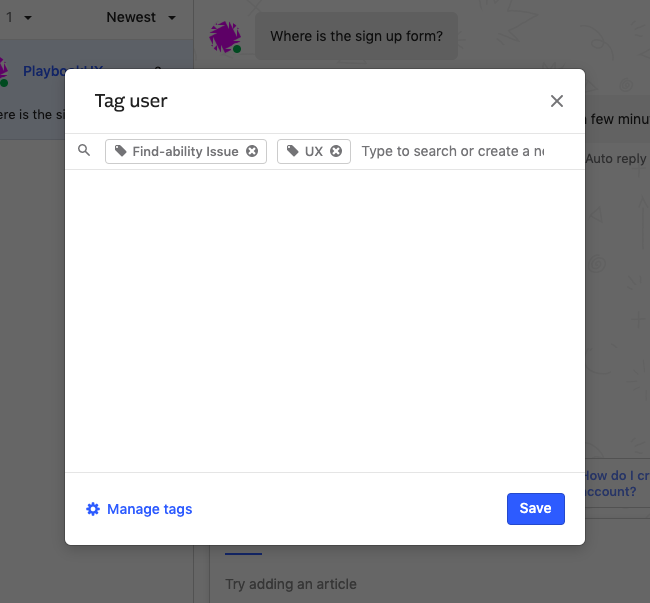
We suggest that you tag chats that could be resolved with UX rework. It will make it easy to sift through the data when you’re looking to track the ROI of UX investment.
Improve user experience to decrease the number of questions that support teams receive will also streamline internal operations. It will free up support team members to focus on long term projects, rather than servicing clients with similar questions.
Revenue per customer
Determine the average revenue per client.
![]()
Investing in UX improves customer satisfaction. Therefore, customers are more likely to continue their subscription, upgrade, or put more orders through. Measure the average revenue per client as a benchmark and observe improvement.
Clickstreams
Analyze clickstreams within your product analytics software, like Google Analytics, to determine the average number of clicks a user takes to reach their goal. Ideally, clicks should decrease as UX improves.
Measuring Internal ROI of UX
Onboarding Costs
Investing in internal UX has its benefits. Improving internal systems decrease on-boarding costs. When a new employee comes on board, companies won’t need to provide endless training. Training costs take the shape of manuals, courses, and team huddles. In order to track training costs, compare training costs before UX investment to after UX investment. Also, create an on-boarding survey to have new employees honestly rate their experience. See how those scores are changing over time with increasing UX investment.
Development Costs
By performing user research, you’ll decrease development costs by saving money and time on rework. After all, “50% of developers time is spent on preventable rework”. Measure how much development time is spend doing rework in any product management software like JIRA. Create an Epic called “UX Rework.” Enter tickets for any design updates or outcomes following your UX studies. Make sure to tag any bugs related to poor UX with the Epic as well. Have your team point the tickets to estimate the effort level. This will give you an idea of how much of a developer’s time is spent on UX rework. However, if you want a more tangible value, determine the hours spent on those stories and multiply that by the developer’s hourly rate. It will justify the ROI of UX while building your next product or feature.
ROI of UX Within Usability Studies
It’s also important to improve usability and findability with each succeeding research session. There are a few ways to benchmark UX and usability during sessions. Improvements will determine the ROI of UX.
Expectation Pointing
This is best used during moderated interviews and unmoderated studies. Ask participants how difficult they expect the task to be (out of 5). After they perform the task, ask them how difficult they felt the task actually was. Finally, when you iterate on designs and conduct a follow-up research session, perform this exercise again with the improved designs.
Net Promoter Question
At the end of a research session, end with the question “How likely is it that you would recommend our product to a colleague or friend?”
Use the following scale to categorize responses.
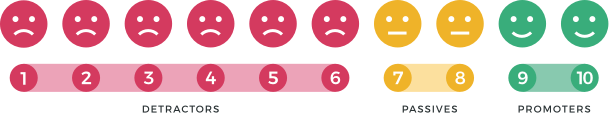
- NPS Promoter: Scores 9-10
- NPS Passive: Scores 7-8
- NPS Detractor: Scores 0-6
Subtract the % Detractors from the % Promoters to determine the NPS. Ignore passive scores.
![]()
System Usability Scale (SUS)
SUS gives a quick and dirty estimate of a system’s usability. Ask SUS questions the end of unmoderated sessions in a post-interview questionnaire. Participants will answer the following questions on a scale of 1 to 5 (with 1=strongly agree & 5=strongly disagree).
- I think that I would like to use this system frequently.
- I found the system unnecessarily complex.
- I thought the system was easy to use.
- I think that I would need the support of a technical person to be able to use this system.
- I found the various functions in this system were well integrated.
- I thought there was too much inconsistency in this system.
- I would imagine that most people would learn to use this system very quickly.
- I found the system very cumbersome to use.
- I felt very confident using the system.
- I needed to learn a lot of things before I could get going with this system.
Here’s how to score the SUS.
- For odd-numbered questions, subtract 1 from the score.
- For even-numbered questions, subtract their value from 5
- Add up the above for a total score and multiply by 2.5.
Now your score is out of 100. Based on research, a SUS score of over 68 is above average and under 68 is below average.
Single Ease Question (SEQ)
It’s a 7-point rating scale that measures how difficult participants find a task. After each task, ask participants “Overall, how difficult or easy was the task to complete?” Participants will rate the task on a scale from very difficult to very easy.

Imagine participants said the task is a 3 (=difficult) out of 7. That’s not ideal. When you iterate on designs and conduct a follow-up research session, determine how difficult the participant found the task with the improved designs. Imagine if the participant says the task is a 6 (=easy) out of 7, then you’ve improved.
Task Completion
This method works best for unmoderated research. After each usability task, ask participants a task completion question. “Did you successfully complete the previous task?” With answers ‘yes,’ ‘no’ and ‘I don’t know.’ Similar to the above methods, perform a research session, iterate, and compare improvements.
Speak to high quality people